Ever since we first formally recorded one more or less a century and a score ago, the seismogram of an earthquake has become an iconic symbol.

Oversimplified and unrealistic ones abound, but natural seismograms of earthquakes are distinctly identifiable. Despite the unique details of every earthquake, seismograms around the world are phenomenally similar. The differences among them are actually what allow seismologists to understand the propagation of earthquakes and the structure of the planet, but that’s a more technical story for a different time. For now, let’s talk about what a seismogram shows.
When an impulsive force impacts our rocky planet, the motion it produces in one place is transmitted to another place by a wave of energy pushing its way through the rock. This is able to happen because–hard though they are–rocks store and release elastic strain. This basically means that rocks bend… and bend back. (Fundamentally, it means they resume their original shape after being deformed. But bulk rheology of the crust is a whole different can of worms here….)

If you tried to pick up a rock and bend it with your hands, you’d have a rough time. With a vice or hydraulic leverage you’d have a little more success, but you’d never see it with your naked eye. When the Earth’s rocky crust bends, it does so by mere meters across distances of kilometers to tens of kilometers. That’s about all it can support before snapping–”brittle failure” if you want to sound technical. Do the conversion real quick: that means if you’re squeezing a 10-cm rock in a vice, the most you could flex one side relative to the other is on the order of 0.1 mm, a bit less than half the size of a pixel on your 2-year-old laptop screen. At that point it would snap. On a large scale, that snap is what causes an earthquake, because the rest of the rock has to un-bend now that it has been released, and it carries us along for the ride. For now we’ll skip the increasing controversies of simple elastic rebound theory of earthquakes, and jump to the propagation of these waves–after all, that’s what all those squiggles are.
The impulse of an earthquake (nevermind why the impulse happens, for now) will radiate outward in a sphere, like a nuclear shockwave.

The portion of that impulse that is directed outward will travel faster, because particles are being pushed in the direction the wave is propagating. The portion of the impulse that is tangential (sideways) to the ever-expanding sphere of energy will travel outward more slowly, because it’s dragging particles, one by one, in a direction perpendicular to the way the wave is moving. So the energy immediately divides into longitudinal and transverse waves because of inherent properties of the physical universe. These are the P- and S- waves, and there’s been plenty written introducing them. Suffice it to say here that the P waves are “smaller” and faster.
These spherical wavefronts emanate from the source, which is pretty cool by itself, but they do all kinds of neat things because there are all these compositional and density boundaries within the body of the Earth. When a wave hits material of a different density, its velocity changes. The effect this has, which I’ll let this guy illustrate, is to bend both the wavefront and the individual theoretical raypaths that track an abstract “part” of the wave. This behavior is what’s responsible for things appearing bent when seen through both water and air. The best way to wrap your head around this might be to play around with it yourself. Wolfram Alpha has an interactive refraction demonstration you can futz with. http://demonstrations.wolfram.com/SnellsLawOfRefractionWaveFronts/

Snell’s Law in action. Don’t wrap your head this far around it.
Anyway, bending and bouncing (refracting and reflecting, to use the physical terms for waves), the spherical shell of seismic energy spreads its way through the globe. Seismometers all around the planet will detect the particle motion each time one of these direct or reflected waves arrives. There will be a new impulse for each bounce of each wave off of each layer below. For example, a seismometer will get a P wave, then an S wave… then a P wave that bounced off of the Earth’s core and came back up, then the S wave that reflected off the core.
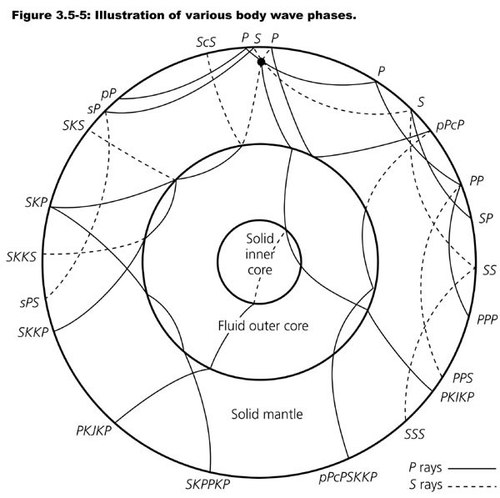
An example set of selected seismic raypaths, illustrating their daunting nomenclature that develops trying to name various reflected and refracted phases. Figure from Stein and Wysession, 2003.
This gets really messy really fast, and we haven’t even addressed P-to-S conversions. Fortunately energy is dissipated the more these waves bounce around, so some signals are stronger and more distinct than others. The initial direct P and S impulses, for example, are inherently the strongest. Every time each one is reflected it loses energy.
When they actually propagate along those paths (and the infinitesimal others between them) they arrive at different parts of the world in, well, waves, but it’s pretty busy:

Global seismic records of the body waves from the big quake in New Zealand on July 21. Annotated are lines connecting the arrival times of various different seismic wave phases at each station. Looks crazy, but it’s just spheres reflecting off of spheres inside spheres. Oh and they bend. Figure from IRIS.edu’s event data plots
How in the world do you get those complicated crossing patterns, you ask? Well thankfully, Michael Thorne and his animations are here to help you. Thorne and his colleagues just authored the most recent “EduQuakes” column in Seismological Research Letters. The article is available to read, but you can go directly to Thorne’s website to get all kinds of neat animations illustrating different wave phases in different ways.

Click to access http://web.utah.edu/thorne/animations.html
This is a great educational resource for anyone trying to wrap their head around Snell’s Law (like that polar bear), or for Earth Science and physics educators who need animations to illustrate this core concept and its application to global geophysics.
http://web.utah.edu/thorne/animations.html
So part of what you see in a seismogram is the bouncing and bending of several different kinds of waves. The core and layers deep in the mantle are not the only boundaries that reflect seismic waves. Ancient sedimentary layers and basin-bounding granitic basement rock also serve as good reflectors, but are extremely shallow features in the scheme of the Earth. Unfortunately, our seismometers mostly sit on top of all of these shallow complexities, so the shallow scattering and bouncing of seismic waves contributes substantially to the “zig zagginess” of a seismogram. The other culprit? The complexity of the fault rupture itself… but that’s one of my favorite topics and I shall save it for another time.